Discover how we enhanced our development process for the Daylight project, from debugging tips to performance boosts maintaining a clean codebase. Meet you down below!
Welcome back to our Daylight blog series! If you liked our first post on creating those soft and warm shadows, hold on to your seat. In this second part, we will share with you how we enhanced our dev experience for the Daylight project. We’ll talk about all sorts of topics, from the debugging experience to how we managed to keep the project smooth and clean, keeping an organized codebase. Let’s dive in 🫡.
About debugging
If there's one golden rule we've learned, it would be to ensure quick and solid progress: you should STOP guessing. You need tools that give you detailed, quick, and accurate information to help you understand what’s happening, confirming your suspicions or proving you wrong.
In Daylight, we had three main goals to achieve: WebGL Scene, Animations, and HTML + WebGL integration. To tackle these, we created a set of tools to meet our needs:
- Debug state
- Leva + Mousetrap debug hotkeys
- Leverage the power of timeline visualization for animations
Debug state
We believe that the debugging experience could be better than console.log-driven development. It should also be thin enough to be your first fast alternative when facing an issue because, let's be honest, you'll always take the faster route in a rush.
Our take here was to hide the debug state behind a ?debug param on the url, and a hook to listen to that state. This not only allows anyone to enable it without running the full dev environment but also enhances collaboration. Our designers can participate in the development process by tweaking Leva parameters, for example, making the final result even better.
export const WebGLScene = () => {
  const isDebug = useDebug()

  return (
    <>
      {/* ...scene components... */}
      {isDebug && <CameraHelper />}
    </>
  )
}
Leva + Mousetrap debug hotkeys
At first, our debug state of the app was accessible through URL parameters, and all of our debugging tools were displayed on the screen. But, it quickly became a mess due to the amount of space it occupied, making our dev environment look like some sort of spaceship cockpit, messing up the development experience. We needed a less annoying solution.
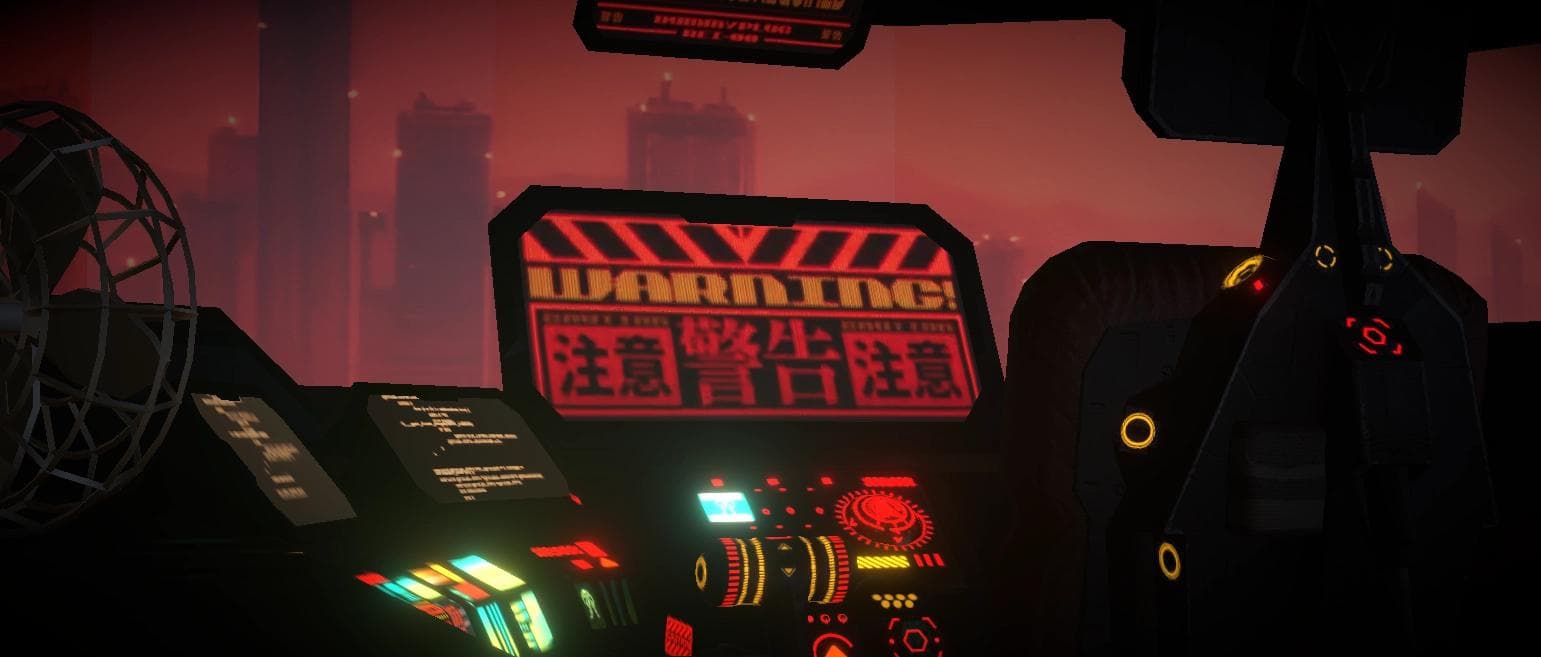
Splash art from https://foundry.basement.studio/fonts/b-mecha
We came up with the idea of hiding each debug tool behind a shortcut. This way, they stay out of sight when you don’t need them but close enough to bring them to you on those desperate debug sessions 😬. We also use Leva to manage and visualize the state of the enabled helpers so we keep them reachable to those who are not that involved in the project.
Here are some of them:
- (M): Set camera mode to “Main”, shows the scene as it is intended to be displayed
- (O): Set camera mode to “Orbit”, orbits around the shadow scene.
- (S): Set camera mode to “Shadow”, displays what the shadow camera sees and renders into the shadow render target.
- (SHIFT+S): Show the scene that is being used to render the shadows
- (D): Toggles information about the device
- (G): Toggles a 10x10 grid helper on the scene.
- (L): Toggles the shadow camera frustum box debugger.
- (C): Cicles between the cameras
Visually debug animations
At basement we’ve been extensively using GSAP to power our animations over the years. We found ourselves running into the same patterns over and over again, so we built abstractions on top of it. As the complexity of our work started to rise, we eventually felt the need to put into visuals all the timeline work we do on complex animations. Not only for debugging purposes, but also because it enables us to share it with the team and speak a common language for those who don’t necessarily know about GSAP. This motivated us to build an internal tool we call the Visualizer.
It initially started as part of the @bsmnt/scrollytelling library, but we noticed that a stand-alone version would also be useful for non-scrollytelling timelines. So we forked it, some UI refresh rounds after, and boom… look at this beauty.
We can plug any timeline into it, and it packs a handful of features:
- Displays an “After Effects”- like timeline visualization, with distinctive representations for animations (
gsap.to), setters (gsap.set) and waypoints (a@bsmnt/scrollytellinglibrary component). - Gives you overall information about your animations, including total tweens and duration, total pixels in the case of Scrolltrigger animations, ease type, relative tween progress and more.
- Integrates with our scrollytelling library to help us identify bugs on tween creation side effects (Scrolltrigger timeline tweens relative durations being shrunk due to the addition of new ones).
- Features a “Web Inspector”-like hover to highlight animation target nodes.
Performance improvements
importAfterInteractive until
We aimed for the site to be fast, without any loading screens. To achieve this, a crucial technique is to initially load only what's necessary and delay the loading of non-essential scripts for later.
For example, the hero section has a image sequence that plays on scroll. It also has a component that uses react-player. We don’t want to load all that right away. Instead, we can wait until the page is fully interactive (i.e., all assets are loaded and the page is clickable).
"use client"

import { importAfterInteractive } from '~/components/dynamic'

const HeroPlayer = importAfterInteractive(() => import('./hero-player'))

export const Hero => (
  <div>
    <HeroPlayer />
  </div>
)
But, I want the users to see a hero section as soon as they enter the page, so we added a way to define a placeholder component while it loads:
"use client"

import { importAfterInteractive } from '~/components/dynamic'
import heroPlaceholder from './hero-placeholder.webp'

const HeroPlayer = importAfterInteractive(() => import('./hero-player'), {
  placeholder: () => (
    <Image fill sizes="100vw" src={heroPlaceholder} />
  )
})

export const Hero => (
  <div>
    <HeroPlayer />
  </div>
)
This means that the user will see a background image immediately upon entering the page, and then the canvas interaction will start loading.
Let’s take a look at the network tab.
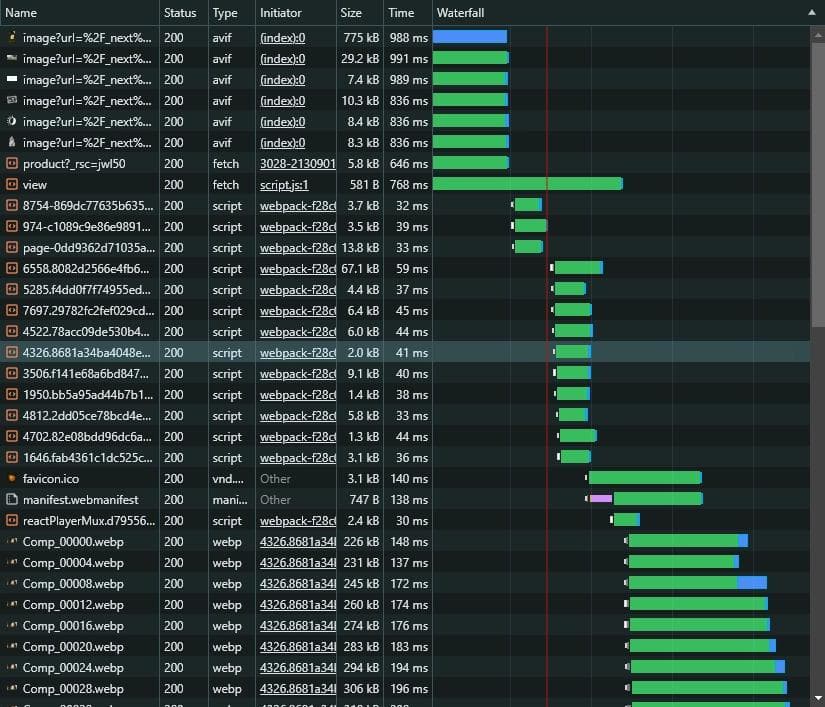
See all the requests that happen after the red line? Those are requests to load webgl components, modules like react-video, and the assets for the scroll sequence.
Enable effects dynamically
The daylight site has a combination of effects that helps improve the page's narrative. However, not all the devices are powered by the best hardware out there. Plus, there’s a percentage of devices that will open your website on low battery, a state in which devices limit their hardware capacity in favor of power efficiency.
To maintain a decent performance on the site, we must turn off specific effects depending on the device. We use the following libraries to decide which effects to turn on/off:
react-device-detect: This library uses a technique called user agent sniffing to detect device information.detect-gpu: Classifies GPUs based on their 3D rendering benchmark score.react-use>useBattery: React sensor hook that tracks battery status.
No blocking tasks
At one point in development, we noticed a substantial drop in FPS when navigating between pages. Once again, Chrome DevTools were a huge help.
Under the Performance tab, we identified that there was a significant amount of JS that was triggering Style and Layout recalculations right after page navigation. Digging in, all the clues pointed to the same place, GSAP. The thing was that all of our section animations on the site were being instantiated simultaneously, causing a lag spike, especially on the navigation bar closing animation.
The workaround for this problem was to delay the creation of the GSAP tweens until all the "priority" animations had finished running. We created a thin wrapper for the useGSAP hook called useNoBlockingGSAP that subscribes to the GSAP execution for later.
useNoBlockingGSAP(() => {
  const tl = gsap.timeline()
  tl.to('#foo', { x: 100 })
}, [])
First, we categorize some animations as "high priority". These animations run during page transitions, such as when the navigation bar closes or the body changes its contents. Once these animations have finished running, all the GSAP hooks will start creating their animations, that needed to be created anyway, but now at a more convenient time.
Offscreen Canvas
The OffscreenCanvas API offers a way to detach the canvas context rendering steps from the main thread, resulting in significant performance boosts depending on your use-case. Or it leaves more room on the main thread reserved for magic, depending on how you see it 😉.
We have a bunch of canvases for Image sequences, WebGL, and noise overlay. Some of them don’t need to be document-synchronized, and some of them do. We needed a way to quickly set them up without caring about resizing, device pixel ratio, offscreen setup, and state management. React hooks are your friends here.
export const useCanvas2D = ({ offscreen = false, maxDpr = 2, options }) => {
  const [canvasRef, _setCanvasRef] = useState(null)
  const [ctx, setCtx] = useState(null)
  const [dpr, setDpr] = useState(1)
  /* 📦 react-use-measure */
  const [setWrapperRef, { width, height }] = useMeasure()

  useLayoutEffect(() => {
    setDpr(Math.min(window.devicePixelRatio, maxDpr))
  }, [width, height, maxDpr])

  useEffect(() => {
    ctx?.scale(dpr, dpr)
  }, [dpr, ctx])

  useEffect(() => {
    if (!canvasRef) return

    let canvas = canvasRef

    const _ctx = canvas?.getContext('2d', options)

    if (!_ctx) return

    setCtx(_ctx)
  }, [canvasRef])

  const setCanvasRef = useCallback((canvas) => {
    if (!canvas) return

    if (offscreen && 'transferControlToOffscreen' in canvas) {
      _setCanvasRef(canvas.transferControlToOffscreen())
      return
    }

    _setCanvasRef(canvas)
  }, [offscreen])

  useEffect(() => {
    if (!canvasRef) return

    canvasRef.width = width * dpr
    canvasRef.height = height * dpr

  }, [canvasRef, width, height, dpr])

  return [setCanvasRef, setWrapperRef, { ctx, dpr, width, height }]
}
Here’s a simple demo rocking OffscreenCanvas.
Wrap it up!
We hope you found these insights into our development process both useful and inspiring. We’ve shared a bunch of tips and tricks that made our debugging process faster and more collaborative, improved our performance, and helped keep our codebase clean and organized.
That’s it for today. Stay tuned for more updates in our upcoming posts.